
Business Intelligence (BI): Essential Concepts and Applications
What is Business Intelligence?
Business Intelligence (BI) is a comprehensive computer-based approach for identifying, extracting, and analyzing business data to support informed decision-making. It enables senior management to examine key metrics such as sales revenue by products, departments, costs, and income streams. BI technologies provide three critical perspectives of business operations:
- Historical analysis - Understanding past performance and trends
- Current monitoring - Real-time operational insights
- Predictive modeling - Forecasting future outcomes
This holistic view empowers management to make strategic and operational decisions with confidence and precision.
Why Organizations Need Business Intelligence
Business Intelligence serves multiple critical functions across various analytical domains:
Core BI Applications
- Reporting and Analytics - Comprehensive data visualization and interpretation
- Online Analytical Processing (OLAP) - Interactive multidimensional analysis
- Data Mining - Pattern discovery and predictive modeling
- Process Mining - Business process optimization
- Performance Management - KPI monitoring and benchmarking
- Text Mining - Extracting insights from unstructured content
- Complex Event Processing - Real-time data stream analysis
Strategic Business Value
BI enables management to monitor objectives from a high-level perspective, providing clarity on:
- What is happening - Current business state and performance
- Why it’s happening - Root cause analysis and trend identification
- What action to take - Data-driven decision support for achieving objectives
Essentially, BI functions as a sophisticated Decision Support System (DSS), delivering the right information at the right time in the right format.
Real-World Example: ERP Development Decision
Consider a software company evaluating whether to develop an Enterprise Resource Planning (ERP) system:
Pre-Development Analysis:
- Development cost estimation and resource allocation
- Market potential and sales volume projections
- Competitive landscape assessment
- Profit margin protection strategies
During Development:
- Real-time project status monitoring through executive dashboards
- Cost-effectiveness tracking without document deep-dives
- Performance indicators for timely corrective actions
BI provides the consolidated visual perspective necessary for informed decision-making at every stage.
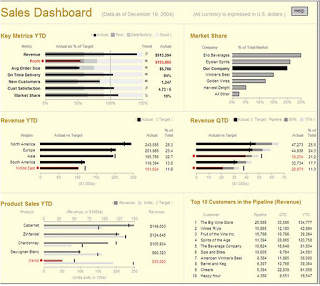
Sample Sales Dashboard
Implementation Prerequisites
Before implementing a BI solution, it’s essential to evaluate several critical factors. According to Kimball et al., these three areas must be thoroughly assessed within your organization:
1. Executive Commitment and Sponsorship
Strong leadership support and sustained commitment from senior management is crucial for project success and organizational buy-in.
2. Business Need Assessment
Clear identification of business requirements and the specific problems BI will solve ensures alignment with organizational objectives.
3. Data Quality and Availability
Adequate quantity and quality of business data from enterprise, departmental, or individual sources forms the foundation of effective BI implementation.
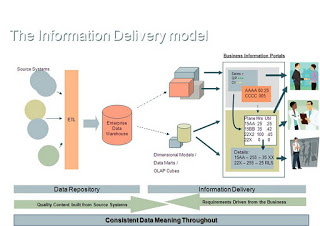
How Business Intelligence Works
Business Intelligence employs a combination of technologies, processes, and applications to analyze primarily internal, structured data and business processes.
Data Warehousing and BI
BI applications commonly utilize data gathered from data warehouses or data marts, though this relationship isn’t always mandatory. Forrester Research distinguishes between two definitions of business intelligence:
Broader Definition: “Business Intelligence is a comprehensive set of methodologies, processes, architectures, and technologies that transform raw data into meaningful and useful information used to enable more effective strategic, tactical, and operational insights and decision-making.”
This encompasses technologies including:
- Data integration and quality management
- Data warehousing and master data management
- Text and content analytics
- Information management components
Narrower Definition: Refers specifically to the top layers of the BI architectural stack, including reporting, analytics, and dashboards.
Business Intelligence vs. Business Analytics
Thomas Davenport suggests dividing business intelligence into distinct components:
- Querying and Reporting - Basic data retrieval and presentation
- OLAP (Online Analytical Processing) - Multidimensional analysis
- Alerts and Monitoring - Real-time notification systems
- Business Analytics - Statistical analysis, prediction, and optimization
MARCKM Framework
Business Intelligence drives value through the MARCKM framework:
- Measurement - KPI tracking and performance metrics
- Analytics - Data analysis and interpretation
- Reporting - Enterprise reporting and visualization
- Collaboration - Platform for team-based decision making
- Knowledge Management - Information organization and retrieval
Proactive BI Features
Modern BI systems provide proactive capabilities:
- Alert Systems - Automatic notifications when business values exceed thresholds
- Visual Indicators - Color-coded warnings (e.g., red alerts for critical values)
- Email Notifications - Automated alerts to relevant stakeholders
- Data Governance - Expert-managed end-to-end processes
Managing Semi-Structured and Unstructured Data
Organizations collect vast amounts of valuable information in various formats:
- Email communications and memos
- Call center notes and chat transcripts
- Reports and presentations
- Web pages and marketing materials
- Image and video files
- News and user-generated content
Data Structure Challenges
While structured data is easily searchable, unstructured data contains a wealth of information needed for comprehensive analysis. In relational database contexts, unstructured data cannot be stored in traditional columns and rows, requiring BLOB (Binary Large Object) storage methods.
Metadata: The Key to Unstructured Data
Metadata serves as the primary method for extracting information from unstructured data. This “data about data” includes:
- Basic metadata - Author information, creation timestamps
- Content metadata - Summaries, topics, entity mentions
- Contextual metadata - Relationships and categorizations
Implementation Challenges
Organizations face several obstacles when working with semi-structured and unstructured data:
- Format Diversity - Multiple storage formats and standards
- Terminology Variations - Lack of standardized vocabulary
- Data Volume - Overwhelming quantities requiring processing
- Search Complexity - Difficulty in locating relevant information
BI Tools and Architecture
The modern BI ecosystem encompasses various tool categories and architectural components:
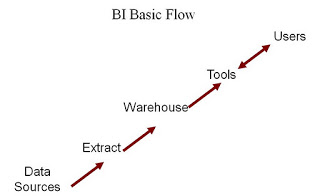
Data Flow Architecture
- Data Sources - Multiple organizational data repositories
- ETL Processes - Extract, Transform, and Load operations
- Data Warehouse - Centralized storage with data mart subdivisions
- OLAP Systems - Multidimensional data cubes for analysis
- BI Tools - User interfaces for data interaction and visualization
Essential BI Tool Categories
Modern organizations typically employ these BI tool types:
- Spreadsheet Applications - Basic analysis and reporting
- Reporting and Querying Software - Data extraction, sorting, and presentation
- Interactive Dashboards - Real-time performance monitoring
- Data Mining Tools - Pattern discovery and predictive analytics
- Data Warehousing Solutions - Large-scale data storage and management
- Decision Engineering Platforms - Automated decision support
- Process Mining Software - Business process analysis and optimization
- Performance Management Systems - KPI tracking and benchmarking
Dashboard Design Principles
According to Stephen Few’s “Information Dashboard Design,” an effective dashboard is “a visual display of the most important information needed to achieve one or more objectives which fits in a single computer screen so it can be monitored at a glance.”
Key dashboard characteristics:
- Single-screen visibility - All critical information immediately accessible
- Glance-based monitoring - Rapid information consumption
- Objective-focused - Aligned with specific business goals
- Visual clarity - Clear, intuitive data representation
Microsoft BI Solution Architecture (2007)
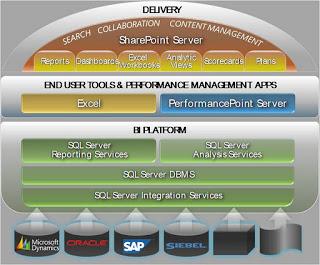
Microsoft’s Business Intelligence architecture demonstrates the integration of various components in a comprehensive BI ecosystem, showcasing how different tools and technologies work together to deliver business value.
Conclusion
Business Intelligence has evolved from a simple reporting tool to a comprehensive strategic asset that drives organizational success. By understanding the fundamental concepts, implementation requirements, and architectural considerations outlined in this guide, organizations can make informed decisions about their BI journey.
The key to successful BI implementation lies in:
- Strategic alignment with business objectives
- Strong executive sponsorship and organizational commitment
- Quality data foundation with proper governance
- Appropriate tool selection for specific use cases
- User adoption through training and change management
As data continues to grow in volume and complexity, Business Intelligence remains essential for transforming raw information into actionable insights that drive competitive advantage and business growth.
Technical Notes
Data Extraction: The process of retrieving data from unstructured or poorly structured sources for further processing or storage. This typically involves importing data into intermediate systems, followed by transformation and metadata addition before export to subsequent workflow stages. Modern electronic devices commonly provide electrical connectors (e.g., USB) for streaming raw data into personal computers for initial processing.

Comments