
Complete Guide to SQL Server Error Logs: Viewing, Analyzing, and Managing Database Logs
Understanding SQL Server Error Logs
SQL Server error logs are crucial diagnostic tools that contain detailed information about system events, errors, warnings, and informational messages. These logs are essential for:
- Troubleshooting database issues
- Monitoring system health
- Tracking security events
- Performance analysis
- Audit compliance
- Proactive maintenance
Types of Information in Error Logs
System Events:
- Server startup and shutdown events
- Service status changes
- Configuration modifications
- Backup and restore operations
Error Messages:
- Connection failures
- Query execution errors
- Hardware-related issues
- Database corruption indicators
Security Events:
- Login attempts (successful and failed)
- Permission changes
- Security policy modifications
- Suspicious activities
Method 1: Using SQL Server Management Studio (SSMS)
Step-by-Step Guide
Step 1: Navigate to SQL Server Logs
- Open SQL Server Management Studio
- Connect to your SQL Server instance
- In Object Explorer, expand your server name
- Expand the Management folder
- Expand SQL Server Logs
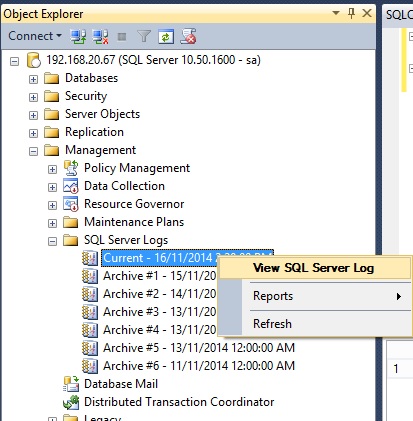
Step 2: Open a Specific Log File
- You’ll see multiple log files:
- Current: The active log file
- Archive #1, #2, etc.: Previous log files
- Right-click on the desired log file
- Select View SQL Server Log
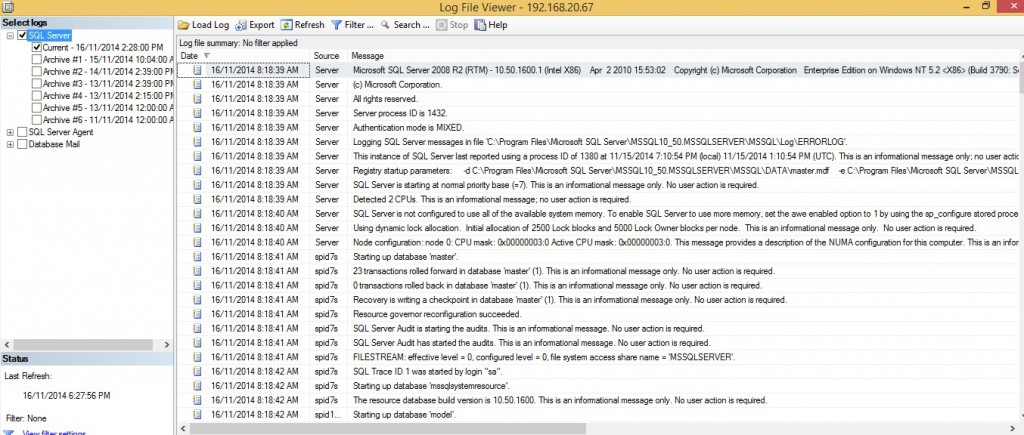
Step 3: Navigate the Log Viewer
The Log File Viewer provides several useful features:
- Filter options: Filter by date, message type, or text
- Search functionality: Find specific errors or events
- Export capabilities: Save logs for analysis
- Multiple log types: View SQL Server, SQL Agent, and Windows logs
Advanced SSMS Features
Filtering Logs:
- In the Log File Viewer, click Filter
- Set criteria such as:
- Date range: Specific time periods
- Message types: Errors, warnings, information
- Message text: Specific error messages or keywords
Exporting Logs:
- Select the entries you want to export
- Right-click and choose Export
- Save as CSV or text file for further analysis
Method 2: Using T-SQL Commands
Reading Current Error Log
-- View the current error log
EXEC xp_readerrorlog;

-- View specific log file (0=current, 1=archive#1, etc.)
EXEC xp_readerrorlog 0;

-- Search for specific text in current log
EXEC xp_readerrorlog 0, 1, 'error';

-- Search with date range
EXEC xp_readerrorlog 0, 1, 'login', NULL, '2026-01-01', '2026-01-12';
Advanced T-SQL Queries
Find Recent Errors:
EXEC xp_readerrorlog 0, 1, 'error', NULL,
    DATEADD(day, -7, GETDATE()), GETDATE();
Search for Failed Logins:
EXEC xp_readerrorlog 0, 1, 'Login failed';
Find Backup/Restore Operations:
EXEC xp_readerrorlog 0, 1, 'backup', NULL,
    DATEADD(day, -1, GETDATE()), GETDATE();
Log File Enumeration
-- List all available error log files
EXEC xp_enumerrorlogs;

-- Get log file information
EXEC sp_readerrorlog;
Method 3: Direct File Access
Log File Locations
Default Paths:
- Error Log:
C:\Program Files\Microsoft SQL Server\MSSQL15.MSSQLSERVER\MSSQL\Log\ERRORLOG - Archive Logs: Same directory with extensions
.1,.2,.3, etc.
Finding Custom Paths:
-- Get current error log path
EXEC xp_readerrorlog 0, 1, 'Logging SQL Server messages in file';

-- Alternative method
SELECT SERVERPROPERTY('ErrorLogFileName') AS ErrorLogPath;
Using PowerShell
# Read error log with PowerShell
Get-Content "C:\Program Files\Microsoft SQL Server\MSSQL15.MSSQLSERVER\MSSQL\Log\ERRORLOG" |
Select-String "error" -Context 2

# Monitor log in real-time
Get-Content "path\to\ERRORLOG" -Wait -Tail 10
Analyzing Common Error Patterns
Critical Errors to Monitor
Database Corruption:
EXEC xp_readerrorlog 0, 1, 'corruption';
EXEC xp_readerrorlog 0, 1, 'CHECKDB';
Memory Issues:
EXEC xp_readerrorlog 0, 1, 'memory';
EXEC xp_readerrorlog 0, 1, 'out of memory';
Connection Problems:
EXEC xp_readerrorlog 0, 1, 'timeout';
EXEC xp_readerrorlog 0, 1, 'connection';
Security Events:
EXEC xp_readerrorlog 0, 1, 'login failed';
EXEC xp_readerrorlog 0, 1, 'access denied';
Understanding Error Severity Levels
| Severity | Description | Action Required |
|---|---|---|
| 0-10 | Informational messages | None |
| 11-16 | User errors | Check application logic |
| 17-19 | Software/hardware errors | Investigate system |
| 20-25 | System errors | Immediate attention |
Log Management Best Practices
1. Log Rotation Configuration
-- Configure number of error log files to retain
EXEC xp_instance_regwrite
    'HKEY_LOCAL_MACHINE',
    'Software\Microsoft\MSSQLServer\MSSQLServer',
    'NumErrorLogs',
    'REG_DWORD',
    30; -- Keep 30 log files
2. Automated Log Cycling
-- Cycle error log (creates new current log)
EXEC sp_cycle_errorlog;

-- Schedule this in SQL Agent for regular cycling
3. Monitoring Script
-- Create a monitoring script for critical errors
CREATE PROCEDURE sp_MonitorErrorLog
AS
BEGIN
    CREATE TABLE #ErrorLogTemp (
        LogDate DATETIME,
        ProcessInfo NVARCHAR(50),
        [Text] NVARCHAR(4000)
    );

    INSERT INTO #ErrorLogTemp
    EXEC xp_readerrorlog 0, 1, 'error', NULL,
        DATEADD(hour, -1, GETDATE()), GETDATE();

    IF @@ROWCOUNT > 0
    BEGIN
        -- Send alert or log to monitoring table
        SELECT * FROM #ErrorLogTemp;
    END

    DROP TABLE #ErrorLogTemp;
END
Troubleshooting Common Scenarios
Scenario 1: Database Won’t Start
Steps to investigate:
- Check the most recent error log
- Look for errors during startup sequence
- Common issues: file path problems, permission issues, corruption
-- Look for startup errors
EXEC xp_readerrorlog 0, 1, 'startup';
EXEC xp_readerrorlog 0, 1, 'recovery';
Scenario 2: Performance Issues
Key indicators to search for:
-- Memory pressure
EXEC xp_readerrorlog 0, 1, 'memory';

-- I/O issues
EXEC xp_readerrorlog 0, 1, 'I/O';

-- Lock timeouts
EXEC xp_readerrorlog 0, 1, 'timeout';
Scenario 3: Security Breach Investigation
-- Failed login attempts
EXEC xp_readerrorlog 0, 1, 'Login failed';

-- Successful logins from specific IPs
EXEC xp_readerrorlog 0, 1, 'Login succeeded';

-- Permission changes
EXEC xp_readerrorlog 0, 1, 'permission';
Advanced Log Analysis Techniques
1. PowerBI Integration
Create PowerBI reports from log data:
-- Export log data for analysis
SELECT
    LogDate,
    ProcessInfo,
    [Text],
    CASE
        WHEN [Text] LIKE '%error%' THEN 'Error'
        WHEN [Text] LIKE '%warning%' THEN 'Warning'
        ELSE 'Information'
    END AS MessageType
FROM (
    EXEC xp_readerrorlog 0
) AS LogData;
2. Log Parsing with Regular Expressions
-- Extract IP addresses from login failures
SELECT
    LogDate,
    [Text],
    SUBSTRING([Text],
        PATINDEX('%[0-9]%.[0-9]%.[0-9]%.[0-9]%', [Text]),
        15) AS IPAddress
FROM (
    EXEC xp_readerrorlog 0, 1, 'Login failed'
) AS LoginFailures;
3. Automated Alerting
-- Create alert for critical errors
EXEC msdb.dbo.sp_add_alert
    @name = 'Critical Error Alert',
    @message_id = 823, -- Disk I/O error
    @severity = 0,
    @notification_message = 'Critical database error detected';
Performance Considerations
1. Log File Size Management
- Monitor log file growth
- Implement regular cycling
- Consider log file location (separate drive)
2. Query Optimization
-- Use date ranges to limit results
EXEC xp_readerrorlog 0, 1, NULL, NULL,
    '2026-01-01 00:00:00', '2026-01-01 23:59:59';

-- Be specific with search terms
EXEC xp_readerrorlog 0, 1, 'specific error message';
Security and Compliance
1. Access Control
- Limit access to error logs
- Use appropriate SQL Server roles
- Audit log access attempts
2. Log Retention Policies
-- Set retention policy
EXEC xp_instance_regwrite
    'HKEY_LOCAL_MACHINE',
    'Software\Microsoft\MSSQLServer\MSSQLServer',
    'NumErrorLogs',
    'REG_DWORD',
    90; -- 90 days retention
3. Compliance Requirements
- Ensure logs meet regulatory requirements
- Implement secure log storage
- Regular log backup procedures
Conclusion
SQL Server error logs are invaluable tools for database administration, troubleshooting, and monitoring. Effective log management includes:
Key Takeaways:
- Multiple Access Methods: Use SSMS for interactive analysis, T-SQL for automation
- Proactive Monitoring: Regular log reviews prevent issues from escalating
- Proper Filtering: Use specific search criteria to find relevant information quickly
- Automated Analysis: Implement scripts and alerts for critical errors
- Security Awareness: Monitor for security events and failed logins
- Performance Impact: Balance log detail with system performance
Best Practices:
- Review logs regularly (daily for production systems)
- Implement automated alerting for critical errors
- Maintain proper log retention policies
- Document common error patterns and solutions
- Train team members on log analysis techniques
By mastering SQL Server error log analysis, you’ll be better equipped to maintain healthy, secure, and high-performing database systems.

Comments