
Implementing Metrics and Dashboards for .NET Core APIs with Prometheus and Grafana
Introduction
In today’s fast-paced software development environment, auditing, security, monitoring the performance and health of your applications is crucial. For .NET Core APIs, integrating Prometheus for metrics collection and Grafana for visualization provides a powerful solution for observability. This article will guide you through the process of implementing metrics and dashboards for your .NET Core APIs using Prometheus and Grafana.
What is Prometheus? Prometheus is an open-source systems monitoring and alerting toolkit originally built at SoundCloud. It collects and stores metrics as time series data, allowing you to monitor your applications and infrastructure effectively. Prometheus support for different types of matrics, including counters, gauges, histograms, and summaries.
What is Grafana? Grafana is an open-source platform for monitoring and observability that allows you to visualize data from various sources, including Prometheus. It provides a rich set of features for creating interactive and customizable dashboards. It supports visualize data through a pluggable architecture. It supports various data sources, including Prometheus, InfluxDB, Elasticsearch, and many others.
Features Offered by Prometheus and Grafana
- Metrics Collection: Prometheus collects metrics from your .NET Core APIs, including request rates, error rates, and response times.
- Data Storage: Prometheus stores the collected metrics in a time-series database, allowing for efficient querying and analysis.
- Visualization: Grafana provides a user-friendly interface to create dashboards and visualize the metrics collected by Prometheus.
- Alerting: Prometheus can be configured to send alerts based on specific conditions, helping you proactively monitor your applications. For example, you can set up alerts for high error rates or slow response times.
- Custom Dashboards: Grafana allows you to create custom dashboards tailored to your monitoring needs, enabling you to focus on the metrics that matter most to your applications.
Pros and Cons of Using Prometheus and Grafana Pros:
- Open-source and free to use.
- Highly customizable and extensible.
- Strong community support and extensive documentation.
- Seamless integration with .NET Core APIs.
- Real-time monitoring and alerting capabilities.
- Broad compatibility with various data sources.
Cons:
- Requires initial setup and configuration.
- May have a learning curve for beginners.
- Resource-intensive for large-scale deployments.
Step-by-Step Guide to Implementing Metrics and Dashboards
Step 1: Create a .NET Core API Project Start by creating a new .NET Core API project using the .NET CLI or Visual Studio.
- Create a solution and a new Web API project:
dotnet new webapi -n EcommerceApi
cd EcommerceApi
dotnet new sln -n EcommerceSolution
dotnet sln add .\EcommerceApi.csproj
Step 2: Install the Required NuGet Packages
Install the following NuGet packages for metrics collection and Prometheus integration:
dotnet add package Microsoft.EntityFrameworkCore.InMemory --version 9.0.0
dotnet add package Swashbuckle.AspNetCore --version 6.8.1
dotnet add package App.Metrics --version 4.3.0
dotnet add package App.Metrics.AspNetCore --version 4.3.0
dotnet add package App.Metrics.AspNetCore.Endpoints --version 4.3.0
dotnet add package App.Metrics.Formatters.Prometheus --version 4.3.0
Package Overview:
- Microsoft.EntityFrameworkCore.InMemory: Provides in-memory database capabilities for development and testing.
- Swashbuckle.AspNetCore: Enables Swagger/OpenAPI documentation for your API endpoints.
- App.Metrics: Core metrics library that provides various metric types (counters, gauges, histograms).
- App.Metrics.AspNetCore: ASP.NET Core integration for automatic HTTP metrics collection.
- App.Metrics.AspNetCore.Endpoints: Provides endpoints to expose metrics data via HTTP.
- App.Metrics.Formatters.Prometheus: Formats metrics data in Prometheus-compatible format for scraping.
Step 3: Create Product Entity in Entities Folder
Create a new folder named Entities and add a Product.cs file to define the Product entity.
namespace EcommerceApi.Entities
{
    public class Product
    {
        public int Id { get; set; }
        public string Name { get; set; } = string.Empty;
        public string Description { get; set; } = string.Empty;
        public decimal Price { get; set; }
        public int StockQuantity { get; set; }

    }
}
Step 4: Set Up the Database Context in Data Folder
Create a new folder named Data and add an EcommerceDbContext.cs file to set up the database context.
using EcommerceApi.Entities;
using Microsoft.EntityFrameworkCore;

namespace EcommerceApi.Data
{
    public class EcommerceDbContext : DbContext
    {
        public EcommerceDbContext(DbContextOptions<EcommerceDbContext> options) : base(options)
        {
        }

        public DbSet<Product> Products { get; set; }

        protected override void OnModelCreating(ModelBuilder modelBuilder)
        {
            base.OnModelCreating(modelBuilder);

            // Seed some initial data for testing
            modelBuilder.Entity<Product>().HasData(
                new Product
                {
                    Id = 1,
                    Name = "Laptop",
                    Description = "High-performance laptop for gaming and work",
                    Price = 999.99m,
                    StockQuantity = 50
                },
                new Product
                {
                    Id = 2,
                    Name = "Smartphone",
                    Description = "Latest smartphone with advanced features",
                    Price = 699.99m,
                    StockQuantity = 100
                },
                new Product
                {
                    Id = 3,
                    Name = "Headphones",
                    Description = "Wireless noise-canceling headphones",
                    Price = 199.99m,
                    StockQuantity = 75
                }
            );
        }
    }
}
Step 5: Create Product Repository in Repositories Folder
Create a new folder named Repositories and add a IProductRepository.cs file to handle data access for products.
using EcommerceApi.Entities;

namespace EcommerceApi.Repositories
{
    public interface IProductRepository
    {
        Task<IEnumerable<Product>> GetAllAsync();
        Task<Product?> GetByIdAsync(int id);
        Task<Product> CreateAsync(Product product);
        Task<Product> UpdateAsync(Product product);
        Task<bool> DeleteAsync(int id);
    }
}
Create a ProductRepository.cs file to implement the repository interface.
using EcommerceApi.Entities;
using EcommerceApi.Data;
using Microsoft.EntityFrameworkCore;

namespace EcommerceApi.Repositories
{
    public class ProductRepository : IProductRepository
    {
        private readonly EcommerceDbContext _context;

        public ProductRepository(EcommerceDbContext context)
        {
            _context = context;
        }

        public async Task<IEnumerable<Product>> GetAllAsync()
        {
            return await _context.Products.ToListAsync();
        }

        public async Task<Product?> GetByIdAsync(int id)
        {
            return await _context.Products.FindAsync(id);
        }

        public async Task<Product> CreateAsync(Product product)
        {
            _context.Products.Add(product);
            await _context.SaveChangesAsync();
            return product;
        }

        public async Task<Product> UpdateAsync(Product product)
        {
            _context.Products.Update(product);
            await _context.SaveChangesAsync();
            return product;
        }

        public async Task<bool> DeleteAsync(int id)
        {
            var product = await GetByIdAsync(id);
            if (product == null)
                return false;

            _context.Products.Remove(product);
            await _context.SaveChangesAsync();
            return true;
        }
    }
}
Step 6: Register Metrics in Metrics Folder
Create a new folder named Metrics and add a MetricsRegistry.cs file to define custom metrics.
using App.Metrics;
using App.Metrics.Counter;
using App.Metrics.Histogram;
using App.Metrics.Timer;
using App.Metrics.Gauge;

namespace EcommerceApi.Metrics
{
    /// <summary>
    /// Centralized metrics registry for tracking various API performance and business metrics
    /// Used for monitoring API usage, performance, errors, and business KPIs in Grafana dashboards
    /// </summary>
    public class MetricsRegistry
    {
        #region Counter Metrics - Track API Call Frequency

        // Product Read Operations
        public static CounterOptions GetByProductIdCounter => new CounterOptions()
        {
            Name = "get_product_by_id_total",
            Context = "ProductAPI",
            MeasurementUnit = App.Metrics.Unit.Calls,
            Tags = new MetricTags("operation", "read")
        };

        public static CounterOptions GetAllProductsCounter => new CounterOptions()
        {
            Name = "get_all_products_total",
            Context = "ProductAPI",
            MeasurementUnit = App.Metrics.Unit.Calls,
            Tags = new MetricTags("operation", "read")
        };

        // Product Write Operations
        public static CounterOptions CreateProductCounter => new CounterOptions()
        {
            Name = "create_product_total",
            Context = "ProductAPI",
            MeasurementUnit = App.Metrics.Unit.Calls,
            Tags = new MetricTags("operation", "create")
        };

        public static CounterOptions UpdateProductCounter => new CounterOptions()
        {
            Name = "update_product_total",
            Context = "ProductAPI",
            MeasurementUnit = App.Metrics.Unit.Calls,
            Tags = new MetricTags("operation", "update")
        };

        public static CounterOptions DeleteProductCounter => new CounterOptions()
        {
            Name = "delete_product_total",
            Context = "ProductAPI",
            MeasurementUnit = App.Metrics.Unit.Calls,
            Tags = new MetricTags("operation", "delete")
        };

        // Error Counters
        public static CounterOptions ProductNotFoundCounter => new CounterOptions()
        {
            Name = "product_not_found_total",
            Context = "ProductAPI",
            MeasurementUnit = App.Metrics.Unit.Errors,
            Tags = new MetricTags("error_type", "not_found")
        };

        public static CounterOptions ValidationErrorCounter => new CounterOptions()
        {
            Name = "validation_error_total",
            Context = "ProductAPI",
            MeasurementUnit = App.Metrics.Unit.Errors,
            Tags = new MetricTags("error_type", "validation")
        };

        public static CounterOptions ServerErrorCounter => new CounterOptions()
        {
            Name = "server_error_total",
            Context = "ProductAPI",
            MeasurementUnit = App.Metrics.Unit.Errors,
            Tags = new MetricTags("error_type", "server_error")
        };

        #endregion

        #region Timer Metrics - Track Response Time Performance

        // API Response Time Timers
        public static TimerOptions GetProductByIdTimer => new TimerOptions()
        {
            Name = "get_product_by_id_duration",
            Context = "ProductAPI",
            MeasurementUnit = App.Metrics.Unit.Requests,
            DurationUnit = TimeUnit.Milliseconds,
            RateUnit = TimeUnit.Seconds
        };

        public static TimerOptions GetAllProductsTimer => new TimerOptions()
        {
            Name = "get_all_products_duration",
            Context = "ProductAPI",
            MeasurementUnit = App.Metrics.Unit.Requests,
            DurationUnit = TimeUnit.Milliseconds,
            RateUnit = TimeUnit.Seconds
        };

        public static TimerOptions CreateProductTimer => new TimerOptions()
        {
            Name = "create_product_duration",
            Context = "ProductAPI",
            MeasurementUnit = App.Metrics.Unit.Requests,
            DurationUnit = TimeUnit.Milliseconds,
            RateUnit = TimeUnit.Seconds
        };

        public static TimerOptions UpdateProductTimer => new TimerOptions()
        {
            Name = "update_product_duration",
            Context = "ProductAPI",
            MeasurementUnit = App.Metrics.Unit.Requests,
            DurationUnit = TimeUnit.Milliseconds,
            RateUnit = TimeUnit.Seconds
        };

        public static TimerOptions DeleteProductTimer => new TimerOptions()
        {
            Name = "delete_product_duration",
            Context = "ProductAPI",
            MeasurementUnit = App.Metrics.Unit.Requests,
            DurationUnit = TimeUnit.Milliseconds,
            RateUnit = TimeUnit.Seconds
        };

        #endregion

        #region Histogram Metrics - Track Distribution of Values

        // Request Size Distribution
        public static HistogramOptions RequestSizeHistogram => new HistogramOptions()
        {
            Name = "request_size_bytes",
            Context = "ProductAPI",
            MeasurementUnit = App.Metrics.Unit.Bytes
        };

        // Response Size Distribution
        public static HistogramOptions ResponseSizeHistogram => new HistogramOptions()
        {
            Name = "response_size_bytes",
            Context = "ProductAPI",
            MeasurementUnit = App.Metrics.Unit.Bytes
        };

        #endregion

        #region Gauge Metrics - Track Current State Values

        // Current System State
        public static GaugeOptions ActiveConnectionsGauge => new GaugeOptions()
        {
            Name = "active_connections_current",
            Context = "ProductAPI",
            MeasurementUnit = App.Metrics.Unit.Connections
        };

        public static GaugeOptions TotalProductsGauge => new GaugeOptions()
        {
            Name = "total_products_current",
            Context = "ProductAPI",
            MeasurementUnit = App.Metrics.Unit.Items
        };

        public static GaugeOptions MemoryUsageGauge => new GaugeOptions()
        {
            Name = "memory_usage_bytes",
            Context = "ProductAPI",
            MeasurementUnit = App.Metrics.Unit.Bytes
        };

        #endregion

        #region Business Metrics - Track Business KPIs

        // Business Intelligence Counters
        public static CounterOptions ProductViewsCounter => new CounterOptions()
        {
            Name = "product_views_total",
            Context = "BusinessMetrics",
            MeasurementUnit = App.Metrics.Unit.Events,
            Tags = new MetricTags("metric_type", "engagement")
        };

        public static CounterOptions ProductCreatedTodayCounter => new CounterOptions()
        {
            Name = "products_created_today_total",
            Context = "BusinessMetrics",
            MeasurementUnit = App.Metrics.Unit.Items,
            Tags = new MetricTags("time_period", "daily")
        };

        // Average Product Price Gauge
        public static GaugeOptions AverageProductPriceGauge => new GaugeOptions()
        {
            Name = "average_product_price",
            Context = "BusinessMetrics",
            MeasurementUnit = App.Metrics.Unit.Custom("currency")
        };

        #endregion

        #region Health Check Metrics

        // Database Health
        public static GaugeOptions DatabaseHealthGauge => new GaugeOptions()
        {
            Name = "database_health_status",
            Context = "HealthCheck",
            MeasurementUnit = App.Metrics.Unit.Custom("status")
        };

        // API Health Score
        public static GaugeOptions ApiHealthScoreGauge => new GaugeOptions()
        {
            Name = "api_health_score",
            Context = "HealthCheck",
            MeasurementUnit = App.Metrics.Unit.Percent
        };

        #endregion
    }
}
Step 7: Create Product Controller in Controllers Folder
- Create a new folder named
Controllersand add aProductsController.csfile to handle API requests for products. - Implement the controller with metrics tracking for each endpoint.
- In the below code, we have implemented metrics tracking for all CRUD operations on products.
using EcommerceApi.Entities;
using EcommerceApi.Repositories;
using EcommerceApi.Metrics;
using Microsoft.AspNetCore.Mvc;
using App.Metrics;
using System.Text.Json;

namespace EcommerceApi.Controllers
{
    [ApiController]
    [Route("api/[controller]")]
    public class ProductController : ControllerBase
    {
        private readonly IProductRepository _productRepository;
        private readonly IMetrics _metrics;

        public ProductController(IProductRepository productRepository, IMetrics metrics)
        {
            _productRepository = productRepository;
            _metrics = metrics;
        }

        // GET: api/Product
        [HttpGet]
        public async Task<ActionResult<IEnumerable<Product>>> GetAllProducts()
        {
            // Start timing the operation
            using var timer = _metrics.Measure.Timer.Time(MetricsRegistry.GetAllProductsTimer);

            try
            {
                // Increment API call counter
                _metrics.Measure.Counter.Increment(MetricsRegistry.GetAllProductsCounter);

                var products = await _productRepository.GetAllAsync();

                // Update business metrics
                _metrics.Measure.Gauge.SetValue(MetricsRegistry.TotalProductsGauge, products.Count());

                // Calculate and update average product price
                if (products.Any())
                {
                    var averagePrice = products.Average(p => p.Price);
                    _metrics.Measure.Gauge.SetValue(MetricsRegistry.AverageProductPriceGauge, (double)averagePrice);
                }

                // Track response size
                var responseJson = JsonSerializer.Serialize(products);
                var responseSize = System.Text.Encoding.UTF8.GetByteCount(responseJson);
                _metrics.Measure.Histogram.Update(MetricsRegistry.ResponseSizeHistogram, responseSize);

                // Update API health score (100 for successful operations)
                _metrics.Measure.Gauge.SetValue(MetricsRegistry.ApiHealthScoreGauge, 100);

                return Ok(products);
            }
            catch (Exception)
            {
                // Track server errors
                _metrics.Measure.Counter.Increment(MetricsRegistry.ServerErrorCounter);

                // Update API health score on error
                _metrics.Measure.Gauge.SetValue(MetricsRegistry.ApiHealthScoreGauge, 0);

                throw;
            }
        }

        // GET: api/Product/5
        [HttpGet("{id}")]
        public async Task<ActionResult<Product>> GetProduct(int id)
        {
            // Start timing the operation
            using var timer = _metrics.Measure.Timer.Time(MetricsRegistry.GetProductByIdTimer);

            try
            {
                // Increment API call counter
                _metrics.Measure.Counter.Increment(MetricsRegistry.GetByProductIdCounter);

                // Track product views for business analytics
                _metrics.Measure.Counter.Increment(MetricsRegistry.ProductViewsCounter);

                var product = await _productRepository.GetByIdAsync(id);

                if (product == null)
                {
                    // Track not found errors
                    _metrics.Measure.Counter.Increment(MetricsRegistry.ProductNotFoundCounter);

                    // Update API health score for client errors (75 - not as bad as server errors)
                    _metrics.Measure.Gauge.SetValue(MetricsRegistry.ApiHealthScoreGauge, 75);

                    return NotFound();
                }

                // Track response size
                var responseJson = JsonSerializer.Serialize(product);
                var responseSize = System.Text.Encoding.UTF8.GetByteCount(responseJson);
                _metrics.Measure.Histogram.Update(MetricsRegistry.ResponseSizeHistogram, responseSize);

                // Update API health score for successful operations
                _metrics.Measure.Gauge.SetValue(MetricsRegistry.ApiHealthScoreGauge, 100);

                return Ok(product);
            }
            catch (Exception)
            {
                // Track server errors
                _metrics.Measure.Counter.Increment(MetricsRegistry.ServerErrorCounter);

                // Update API health score on server error
                _metrics.Measure.Gauge.SetValue(MetricsRegistry.ApiHealthScoreGauge, 0);

                throw;
            }
        }

        // POST: api/Product
        [HttpPost]
        public async Task<ActionResult<Product>> CreateProduct(Product product)
        {
            // Start timing the operation
            using var timer = _metrics.Measure.Timer.Time(MetricsRegistry.CreateProductTimer);

            try
            {
                // Increment API call counter
                _metrics.Measure.Counter.Increment(MetricsRegistry.CreateProductCounter);

                // Track request size
                if (product != null)
                {
                    var requestJson = JsonSerializer.Serialize(product);
                    var requestSize = System.Text.Encoding.UTF8.GetByteCount(requestJson);
                    _metrics.Measure.Histogram.Update(MetricsRegistry.RequestSizeHistogram, requestSize);
                }

                // Validation checks
                if (product == null || string.IsNullOrWhiteSpace(product.Name))
                {
                    // Track validation errors
                    _metrics.Measure.Counter.Increment(MetricsRegistry.ValidationErrorCounter);

                    // Update API health score for validation errors
                    _metrics.Measure.Gauge.SetValue(MetricsRegistry.ApiHealthScoreGauge, 80);

                    return BadRequest("Product name is required");
                }

                var createdProduct = await _productRepository.CreateAsync(product);

                // Track business metrics
                _metrics.Measure.Counter.Increment(MetricsRegistry.ProductCreatedTodayCounter);

                // Update total products count
                var allProducts = await _productRepository.GetAllAsync();
                _metrics.Measure.Gauge.SetValue(MetricsRegistry.TotalProductsGauge, allProducts.Count());

                // Update average price
                if (allProducts.Any())
                {
                    var averagePrice = allProducts.Average(p => p.Price);
                    _metrics.Measure.Gauge.SetValue(MetricsRegistry.AverageProductPriceGauge, (double)averagePrice);
                }

                // Track response size
                var responseJson = JsonSerializer.Serialize(createdProduct);
                var responseSize = System.Text.Encoding.UTF8.GetByteCount(responseJson);
                _metrics.Measure.Histogram.Update(MetricsRegistry.ResponseSizeHistogram, responseSize);

                // Update API health score for successful operations
                _metrics.Measure.Gauge.SetValue(MetricsRegistry.ApiHealthScoreGauge, 100);

                return CreatedAtAction(nameof(GetProduct), new { id = createdProduct.Id }, createdProduct);
            }
            catch (Exception)
            {
                // Track server errors
                _metrics.Measure.Counter.Increment(MetricsRegistry.ServerErrorCounter);

                // Update API health score on server error
                _metrics.Measure.Gauge.SetValue(MetricsRegistry.ApiHealthScoreGauge, 0);

                throw;
            }
        }

        // PUT: api/Product/5
        [HttpPut("{id}")]
        public async Task<IActionResult> UpdateProduct(int id, Product product)
        {
            // Start timing the operation
            using var timer = _metrics.Measure.Timer.Time(MetricsRegistry.UpdateProductTimer);

            try
            {
                // Increment API call counter
                _metrics.Measure.Counter.Increment(MetricsRegistry.UpdateProductCounter);

                // Track request size
                if (product != null)
                {
                    var requestJson = JsonSerializer.Serialize(product);
                    var requestSize = System.Text.Encoding.UTF8.GetByteCount(requestJson);
                    _metrics.Measure.Histogram.Update(MetricsRegistry.RequestSizeHistogram, requestSize);
                }

                // Validation checks
                if (product == null || id != product.Id)
                {
                    // Track validation errors
                    _metrics.Measure.Counter.Increment(MetricsRegistry.ValidationErrorCounter);

                    // Update API health score for validation errors
                    _metrics.Measure.Gauge.SetValue(MetricsRegistry.ApiHealthScoreGauge, 80);

                    return BadRequest("Product ID mismatch");
                }

                if (string.IsNullOrWhiteSpace(product.Name))
                {
                    // Track validation errors
                    _metrics.Measure.Counter.Increment(MetricsRegistry.ValidationErrorCounter);

                    // Update API health score for validation errors
                    _metrics.Measure.Gauge.SetValue(MetricsRegistry.ApiHealthScoreGauge, 80);

                    return BadRequest("Product name is required");
                }

                var existingProduct = await _productRepository.GetByIdAsync(id);
                if (existingProduct == null)
                {
                    // Track not found errors
                    _metrics.Measure.Counter.Increment(MetricsRegistry.ProductNotFoundCounter);

                    // Update API health score for client errors
                    _metrics.Measure.Gauge.SetValue(MetricsRegistry.ApiHealthScoreGauge, 75);

                    return NotFound();
                }

                var updatedProduct = await _productRepository.UpdateAsync(product);

                // Update business metrics after successful update
                var allProducts = await _productRepository.GetAllAsync();
                if (allProducts.Any())
                {
                    var averagePrice = allProducts.Average(p => p.Price);
                    _metrics.Measure.Gauge.SetValue(MetricsRegistry.AverageProductPriceGauge, (double)averagePrice);
                }

                // Update API health score for successful operations
                _metrics.Measure.Gauge.SetValue(MetricsRegistry.ApiHealthScoreGauge, 100);

                return Ok(updatedProduct);
            }
            catch (Exception)
            {
                // Track server errors
                _metrics.Measure.Counter.Increment(MetricsRegistry.ServerErrorCounter);

                // Update API health score on server error
                _metrics.Measure.Gauge.SetValue(MetricsRegistry.ApiHealthScoreGauge, 0);

                throw;
            }
        }

        // DELETE: api/Product/5
        [HttpDelete("{id}")]
        public async Task<IActionResult> DeleteProduct(int id)
        {
            // Start timing the operation
            using var timer = _metrics.Measure.Timer.Time(MetricsRegistry.DeleteProductTimer);

            try
            {
                // Increment API call counter
                _metrics.Measure.Counter.Increment(MetricsRegistry.DeleteProductCounter);

                var result = await _productRepository.DeleteAsync(id);

                if (!result)
                {
                    // Track not found errors
                    _metrics.Measure.Counter.Increment(MetricsRegistry.ProductNotFoundCounter);

                    // Update API health score for client errors
                    _metrics.Measure.Gauge.SetValue(MetricsRegistry.ApiHealthScoreGauge, 75);

                    return NotFound();
                }

                // Update business metrics after successful deletion
                var allProducts = await _productRepository.GetAllAsync();
                _metrics.Measure.Gauge.SetValue(MetricsRegistry.TotalProductsGauge, allProducts.Count());

                // Update average price
                if (allProducts.Any())
                {
                    var averagePrice = allProducts.Average(p => p.Price);
                    _metrics.Measure.Gauge.SetValue(MetricsRegistry.AverageProductPriceGauge, (double)averagePrice);
                }
                else
                {
                    _metrics.Measure.Gauge.SetValue(MetricsRegistry.AverageProductPriceGauge, 0);
                }

                // Update API health score for successful operations
                _metrics.Measure.Gauge.SetValue(MetricsRegistry.ApiHealthScoreGauge, 100);

                return NoContent();
            }
            catch (Exception)
            {
                // Track server errors
                _metrics.Measure.Counter.Increment(MetricsRegistry.ServerErrorCounter);

                // Update API health score on server error
                _metrics.Measure.Gauge.SetValue(MetricsRegistry.ApiHealthScoreGauge, 0);

                throw;
            }
        }
    }
}
Step 8: Configure Program.cs for Metrics, Middleware, and Database
Update the Program.cs file to configure services, middleware, and database context.
using EcommerceApi.Data;
using EcommerceApi.Repositories;
using Microsoft.EntityFrameworkCore;
using App.Metrics;
using App.Metrics.AspNetCore;
using App.Metrics.Formatters.Prometheus;

var builder = WebApplication.CreateBuilder(args);

// Configure metrics with Prometheus formatters and web tracking
// This enables comprehensive HTTP request monitoring and Prometheus integration for Grafana
builder.Host.UseMetricsWebTracking().UseMetrics(options =>
{
    options.EndpointOptions = endpointoptions =>
    {
        // Configure Prometheus text formatter for /metrics-text endpoint (human readable)
        endpointoptions.MetricsTextEndpointOutputFormatter = new MetricsPrometheusTextOutputFormatter();
        // Configure Prometheus protobuf formatter for /metrics endpoint (efficient binary format)
        endpointoptions.MetricsEndpointOutputFormatter = new MetricsPrometheusProtobufOutputFormatter();
        // Disable environment info endpoint to reduce security exposure
        endpointoptions.EnvironmentInfoEndpointEnabled = false;
    };
}).UseMetricsWebTracking(options =>
{
    // Enable Apdex (Application Performance Index) tracking for user satisfaction monitoring
    // Apdex measures response time satisfaction: Satisfied/Tolerating/Frustrated requests
    options.ApdexTrackingEnabled = true;
    // Set Apdex T threshold to 0.1 seconds (100ms) - responses faster than this are "satisfied"
    options.ApdexTSeconds = 0.1;
});

// Add services to the container.
builder.Services.AddControllers();

// Add Swagger services
builder.Services.AddEndpointsApiExplorer();
builder.Services.AddSwaggerGen(c =>
{
    c.SwaggerDoc("v1", new Microsoft.OpenApi.Models.OpenApiInfo
    {
        Title = "Ecommerce API",
        Version = "v1",
        Description = "A simple ecommerce API for product management"
    });
});

// Configure Entity Framework with In-Memory Database
builder.Services.AddDbContext<EcommerceDbContext>(options =>
    options.UseInMemoryDatabase("EcommerceInMemoryDb"));

// Register Repository
builder.Services.AddScoped<IProductRepository, ProductRepository>();

var app = builder.Build();

// Ensure the database is created and seeded
using (var scope = app.Services.CreateScope())
{
    var context = scope.ServiceProvider.GetRequiredService<EcommerceDbContext>();
    context.Database.EnsureCreated();
}

// Configure the HTTP request pipeline.
if (app.Environment.IsDevelopment())
{
    app.UseSwagger();
    app.UseSwaggerUI(c =>
    {
        c.SwaggerEndpoint("/swagger/v1/swagger.json", "Ecommerce API v1");
        c.RoutePrefix = "swagger";
    });
}

app.UseHttpsRedirection();

// Enable metrics collection middleware - automatically tracks HTTP requests/responses
// This captures timing, status codes, and other HTTP metrics for Grafana monitoring
app.UseMetricsAllMiddleware();
// Expose metrics endpoints (/metrics, /metrics-text, /ping) for Prometheus scraping
app.UseMetricsAllEndpoints();

// Map controllers
app.MapControllers();

app.Run();
Now you can run your .NET Core API project, and it will expose metrics at the /metrics endpoint in a Prometheus-compatible format. You can then configure Prometheus to scrape this endpoint and set up Grafana dashboards to visualize the collected metrics.
Example Endpoint:
Swagger UI: http://localhost:5262/swagger
Metrics Endpoints (for Grafana):
http://localhost:5262/metrics - Prometheus protobuf format
http://localhost:5262/metrics-text - Prometheus text format
http://localhost:5262/ping - Health check
Step 9: Setting Up Prometheus
To set up Prometheus to scrape metrics from your .NET Core API, follow these steps:
- Download and Install Prometheus: You can download Prometheus from the official website.
- Download the latest stable version (ex. prometheus-3.8.1.windows-amd64.zip) and extract the files to a directory of your choice.
- Configure Prometheus: After extracting Prometheus, navigate to the directory and you will find a
prometheus.ymlfile. Modify this file to add your .NET Core API as a scrape target.
Create a prometheus.yml configuration file with the following content:
global:
  scrape_interval: 15s
scrape_configs:
  - job_name: 'ecommerce_api'
    static_configs:
      - targets: ['localhost:5262']  # Replace with your API's host and port
- Save and close the file.
- Run Prometheus: To start Prometheus with the updated configuration, run the following command in the terminal from the directory where Prometheus is located:
.\prometheus.exe --config.file=prometheus.yml
- Keep the Prometheus server running to allow it to scrape metrics from your .NET Core API.
- Now you can access the Prometheus web interface at
http://localhost:9090to query and visualize the metrics being collected.

As you can see that Prometheus is configured, you can try with different query to verify or move to next step. For example, you can use the following query to see the total number of requests to the GetAllProducts endpoint:
sum(rate(get_all_products_total[1m]))
And you can use the following query to see the average response time for the GetProductById endpoint:
avg(rate(get_product_by_id_duration_sum[1m])) / avg(rate(get_product_by_id_duration_count[1m]))
Step 10: Setting Up Grafana To set up Grafana to visualize the metrics collected by Prometheus, follow these steps:
- Download and Install Grafana: You can download Grafana from the official website.
- Download the latest stable version which match with your OS (ex. grafana-enterprise_12.3.1_20271043721_windows_amd64.tar.gz) and extract the files to a directory of your choice.
- Run the Grafana server by executing
grafana-server.exein bin folder from the extracted directory. - Keep the Grafana server running to allow access to the web interface.
- Now you can access the Grafana web interface at
http://localhost:3000.
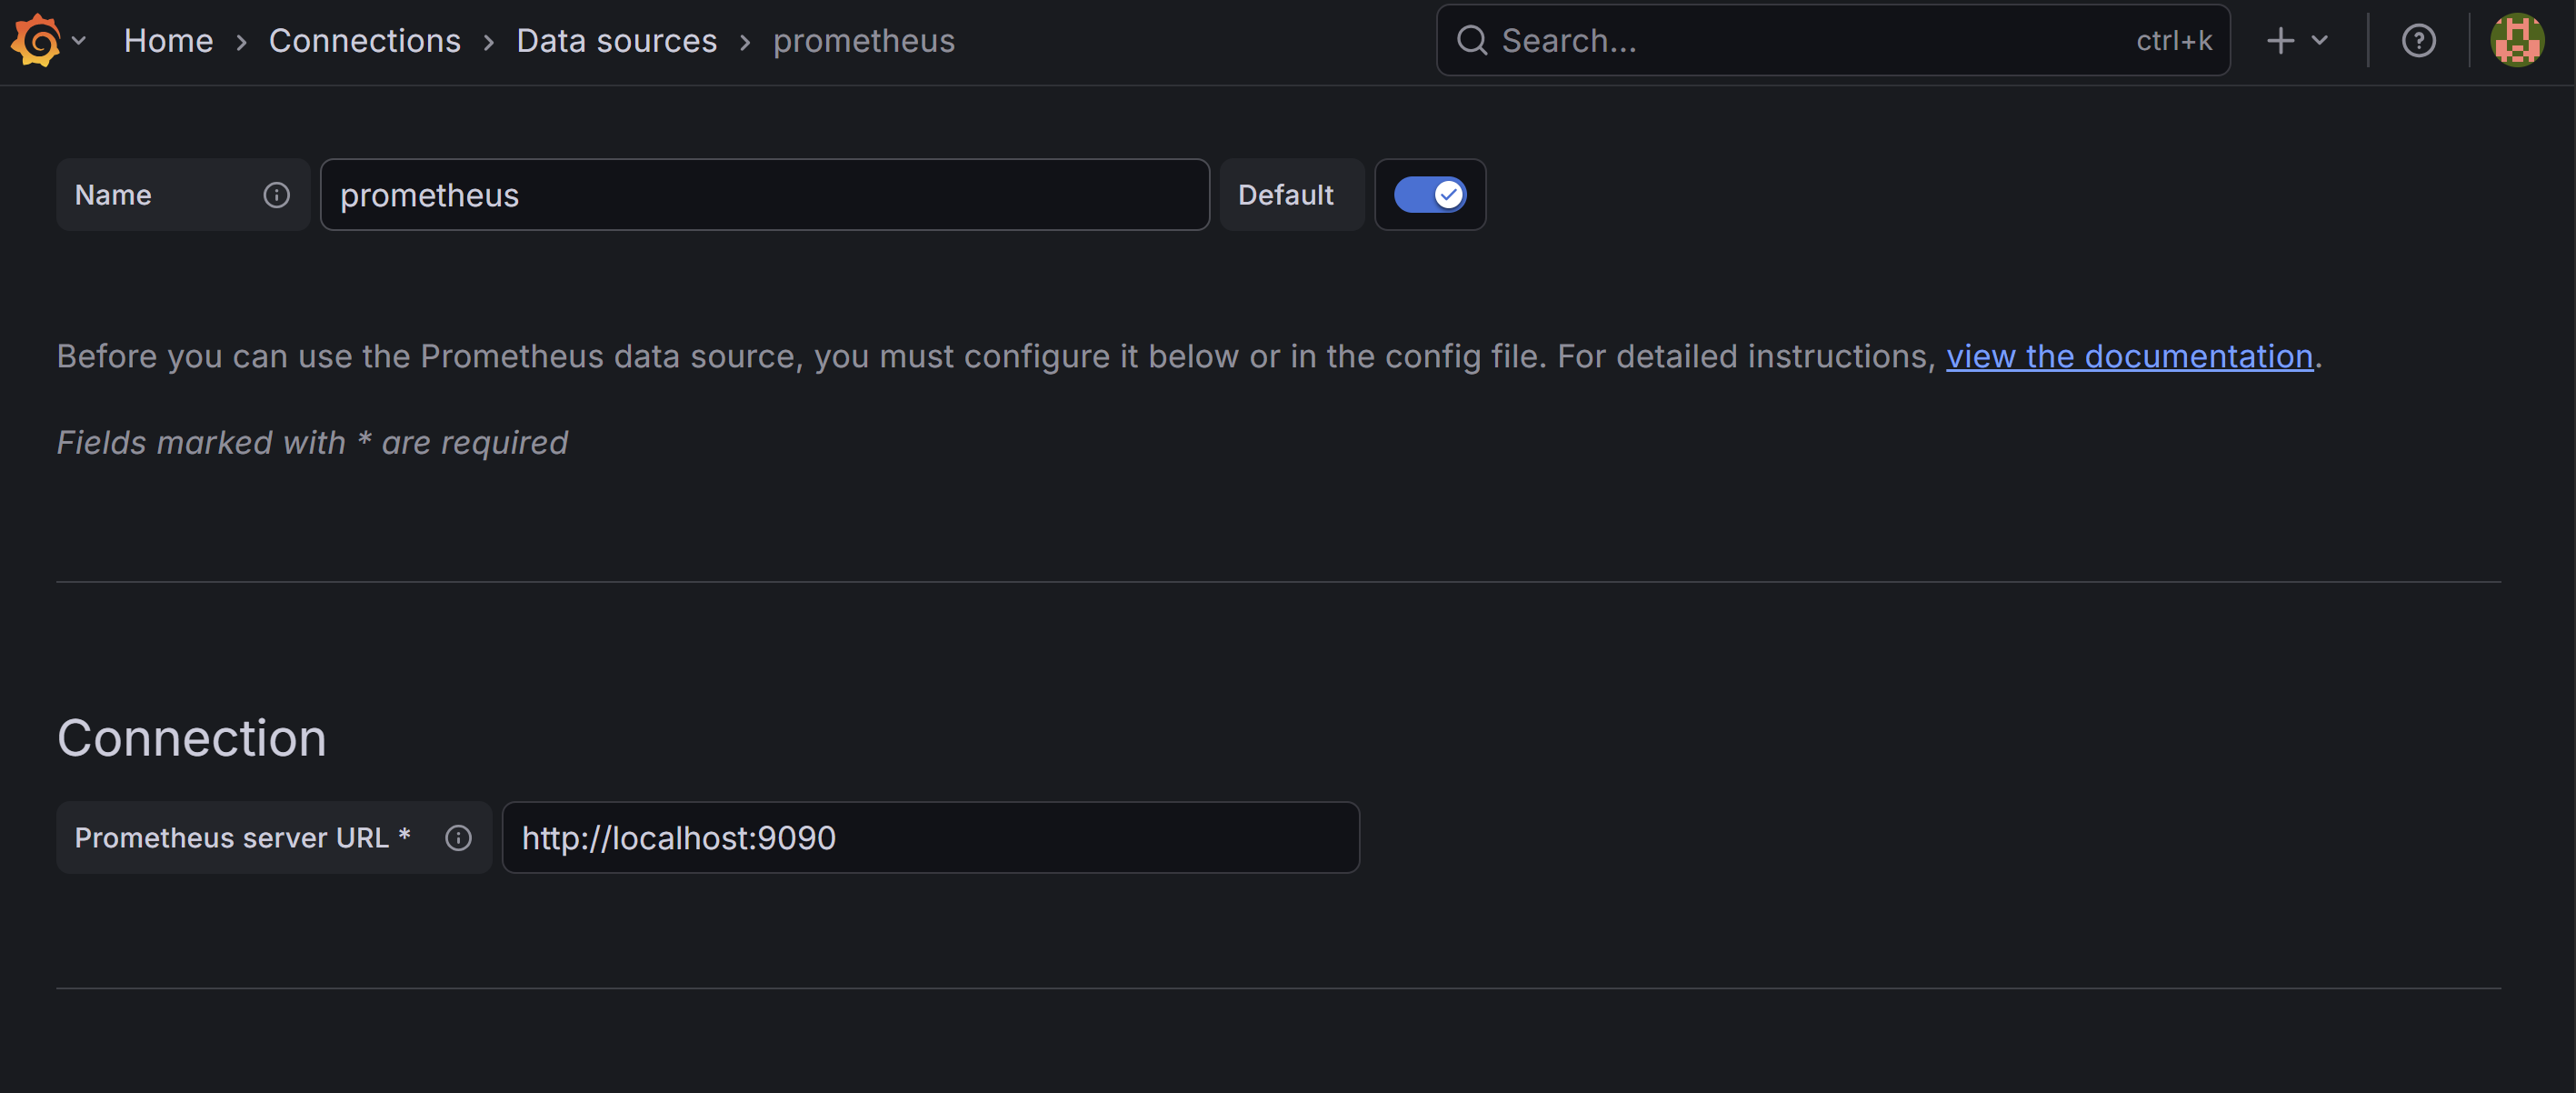
- Add Prometheus as a Data Source:
- Open Grafana in your web browser (default is
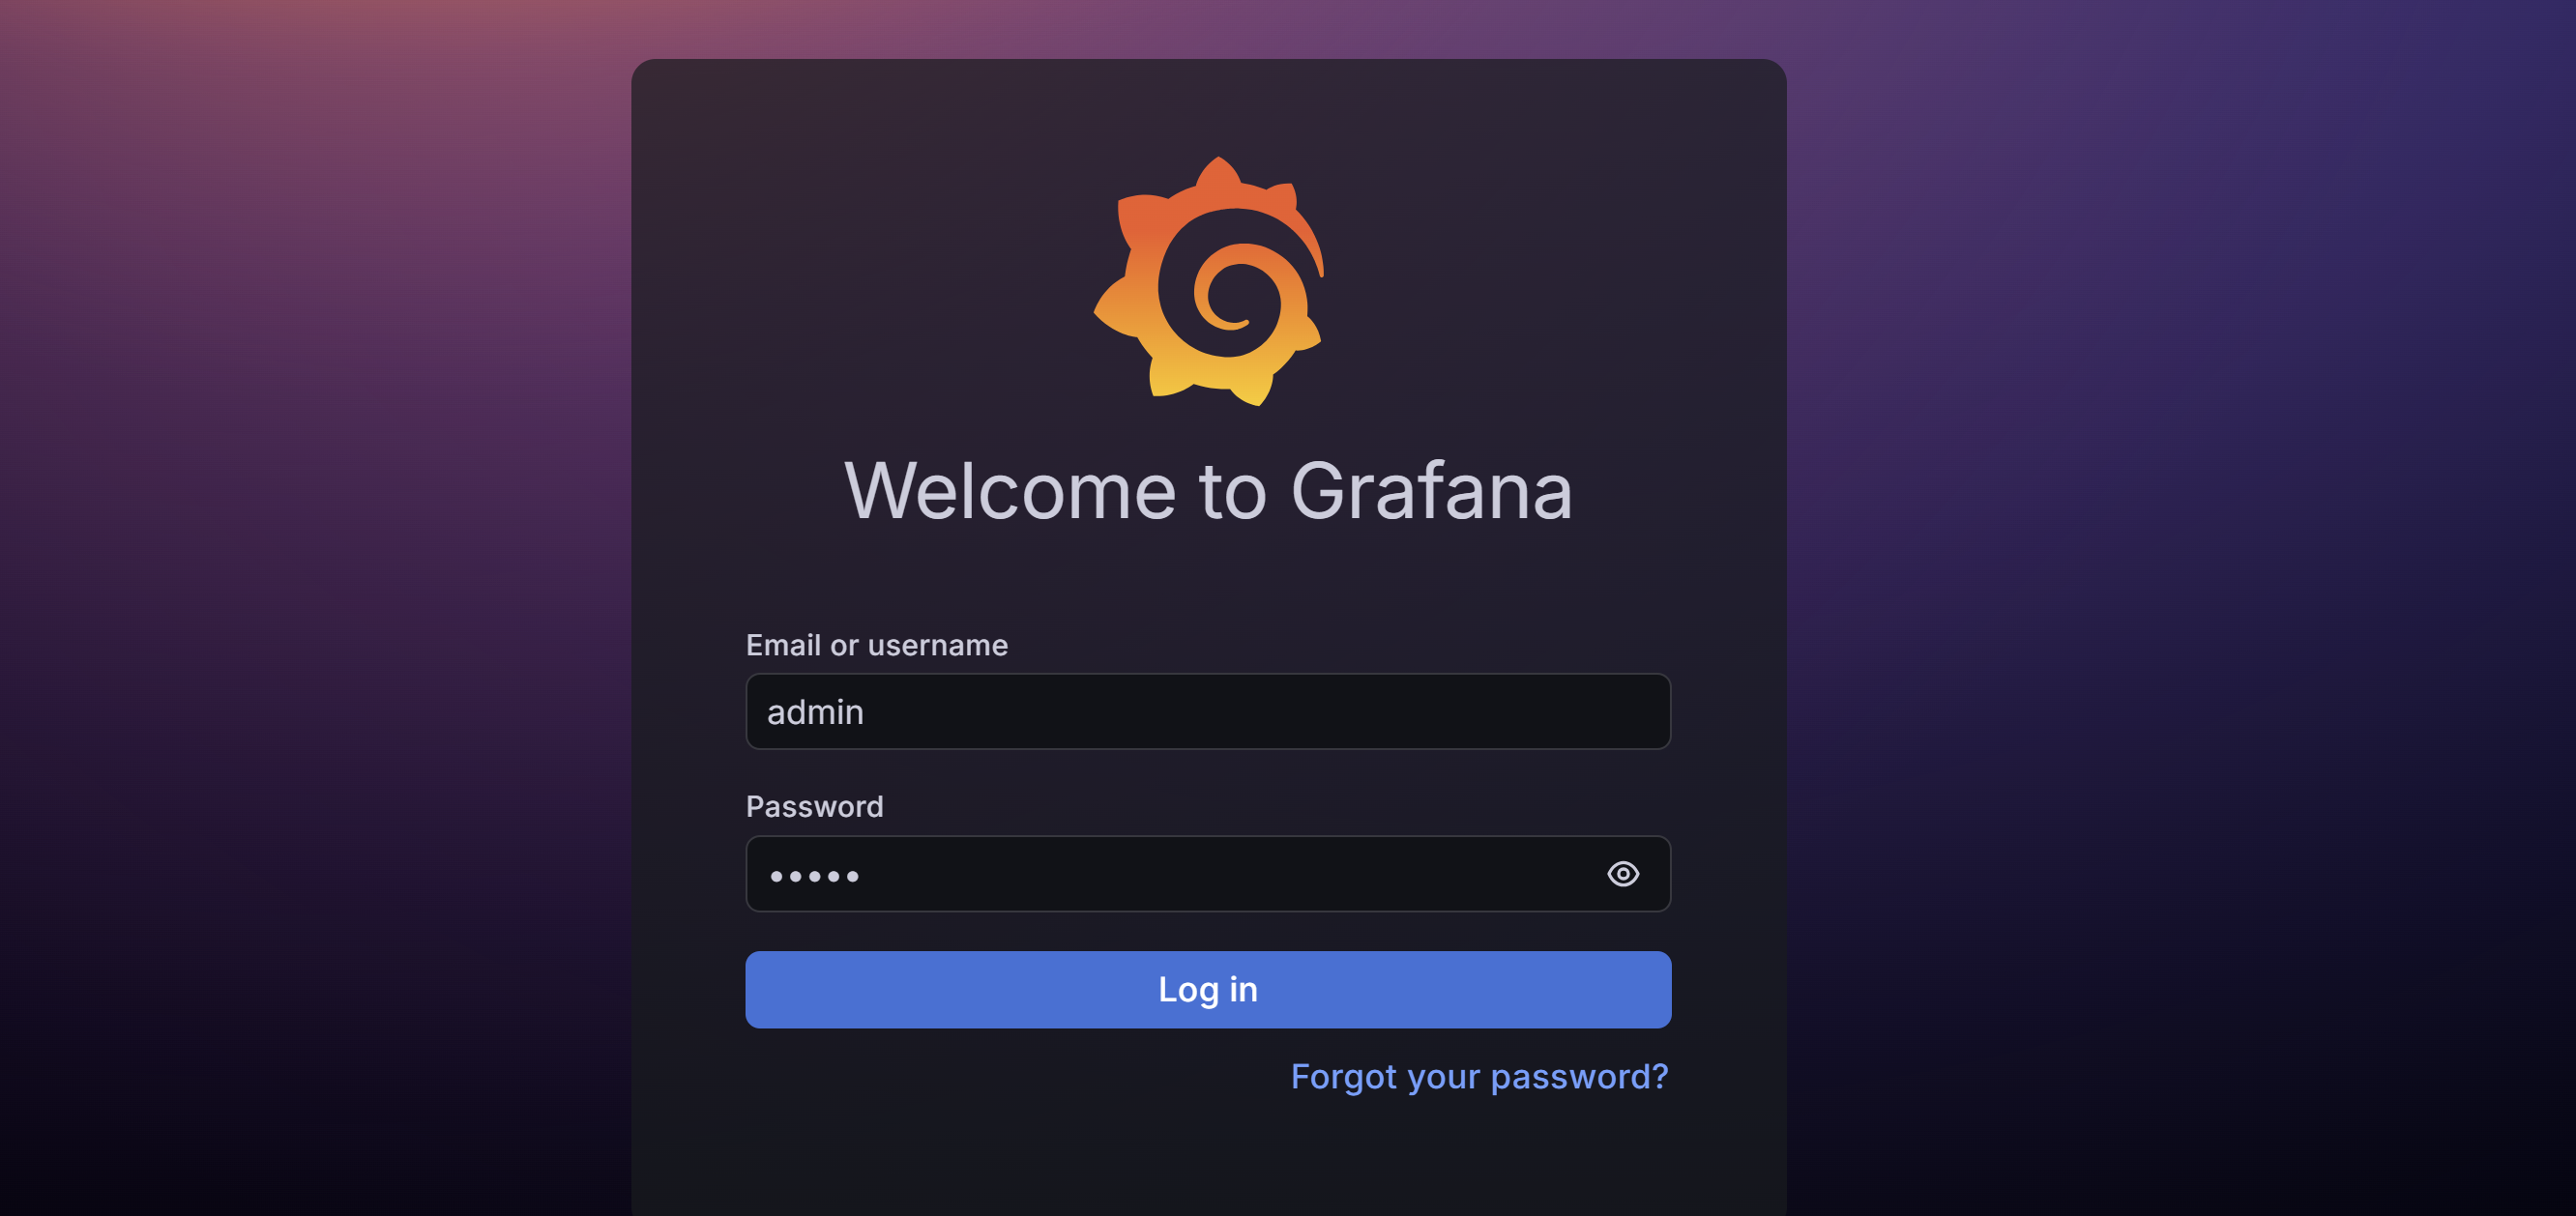
http://localhost:3000). - Log in with the default credentials (
admin/admin). - You can either change the password or skip to keep the default user credential.
- Click on Gear Icon at the top left side and go to “Connections” > “Data Sources” and click “Add data source”.
- Or, from the dashboard home page, click on “Add data source”.
- Select “Prometheus” from the list of data sources.
- Set the URL to
http://localhost:9090(or wherever your Prometheus server is running) and click “Save & Test”.
- Open Grafana in your web browser (default is
Step 11: Configure a Custom Dashboards in Grafana
Step i: Create a New Dashboard
- Click the
+icon at the top right corner - Select “Create” → “Dashboard”
- Click “Add visualization”
- Select your “Prometheus” data source
Step ii: Add Panels for Your API Metrics
Based on your metrics output from http://localhost:5262/metrics-text, create these panels:
Panel 1: Total HTTP Requests
- Title: “Total HTTP Requests”
- Query:
application_httprequests_transactions_count - Panel Type: Stat
- Description: Shows total number of requests processed
- Note: Select Code option to write query
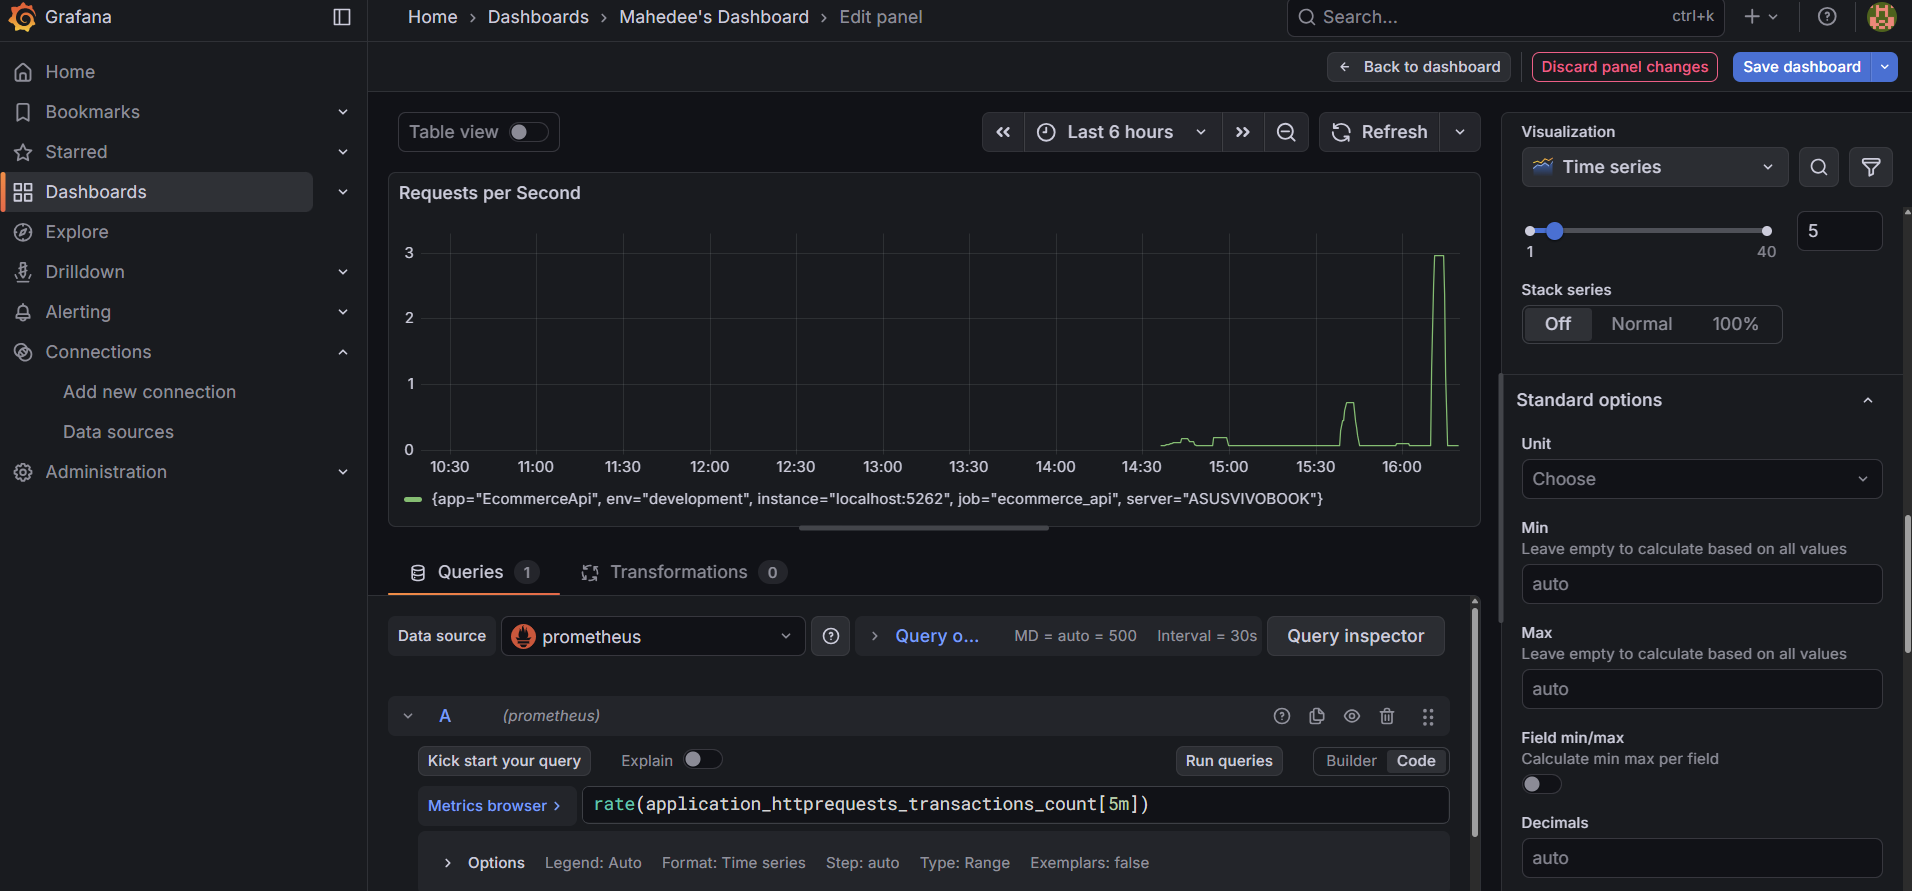
- Save the panel and save the dashboard. In my case - “Mahedee’s Dashboard”
- Now from your dashboard -> Click on Add -> Visualization and the following panels.
Panel 2: Request Rate
- Title: “Requests per Second”
- Query:
rate(application_httprequests_transactions_count[5m]) - Panel Type: Time Series
- Unit: requests/sec
Panel 3: Average Response Time
- Title: “Average Response Time”
- Query:
rate(application_httprequests_transactions_sum[5m]) / rate(application_httprequests_transactions_count[5m]) - Panel Type: Stat
- Unit: seconds
Panel 4: Response Time Percentiles
- Title: “Response Time Distribution”
- Queries:
- Alias “50th”:
application_httprequests_transactions{quantile="0.5"} - Alias “75th”:
application_httprequests_transactions{quantile="0.75"} - Alias “95th”:
application_httprequests_transactions{quantile="0.95"} - Alias “99th”:
application_httprequests_transactions{quantile="0.99"}
- Alias “50th”:
- Panel Type: Time Series
- Unit: seconds
Panel 5: Apdex Score
- Title: “Application Performance Index (User Satisfaction)”
- Query:
application_httprequests_apdex - Panel Type: Stat
- Unit: percent (0-100)
- Thresholds: Green > 85, Yellow > 70, Red < 70
Panel 6: Active Requests
- Title: “Currently Active Requests”
- Query:
application_httprequests_active - Panel Type: Stat
- Unit: short
Note: You can add more panels based on the metrics you have implemented in your .NET Core API. Customize the dashboard layout and styles as per your preference.
Optional Steps: Generate Test Data
Before you can see data in your dashboard, generate some API traffic. You can create a shell script using the following commands and run it in your terminal:
# Generate sustained traffic to create visible metrics
for i in {1..100}; do
  curl http://localhost:5262/api/Product
  curl http://localhost:5262/api/Product/1
  curl http://localhost:5262/api/Product/2
  sleep 0.2
done

# Create some products
curl -X POST http://localhost:5262/api/Product \
  -H "Content-Type: application/json" \
  -d '{"name":"Dashboard Test Product","description":"Testing dashboard","price":99.99,"stockQuantity":10}'

# Test 404 errors
curl http://localhost:5262/api/Product/999
curl http://localhost:5262/api/Product/888
Step iii: View your dashboard
- After adding all the panels, save your dashboard. You should now see real-time metrics from your .NET Core API displayed in Grafana.

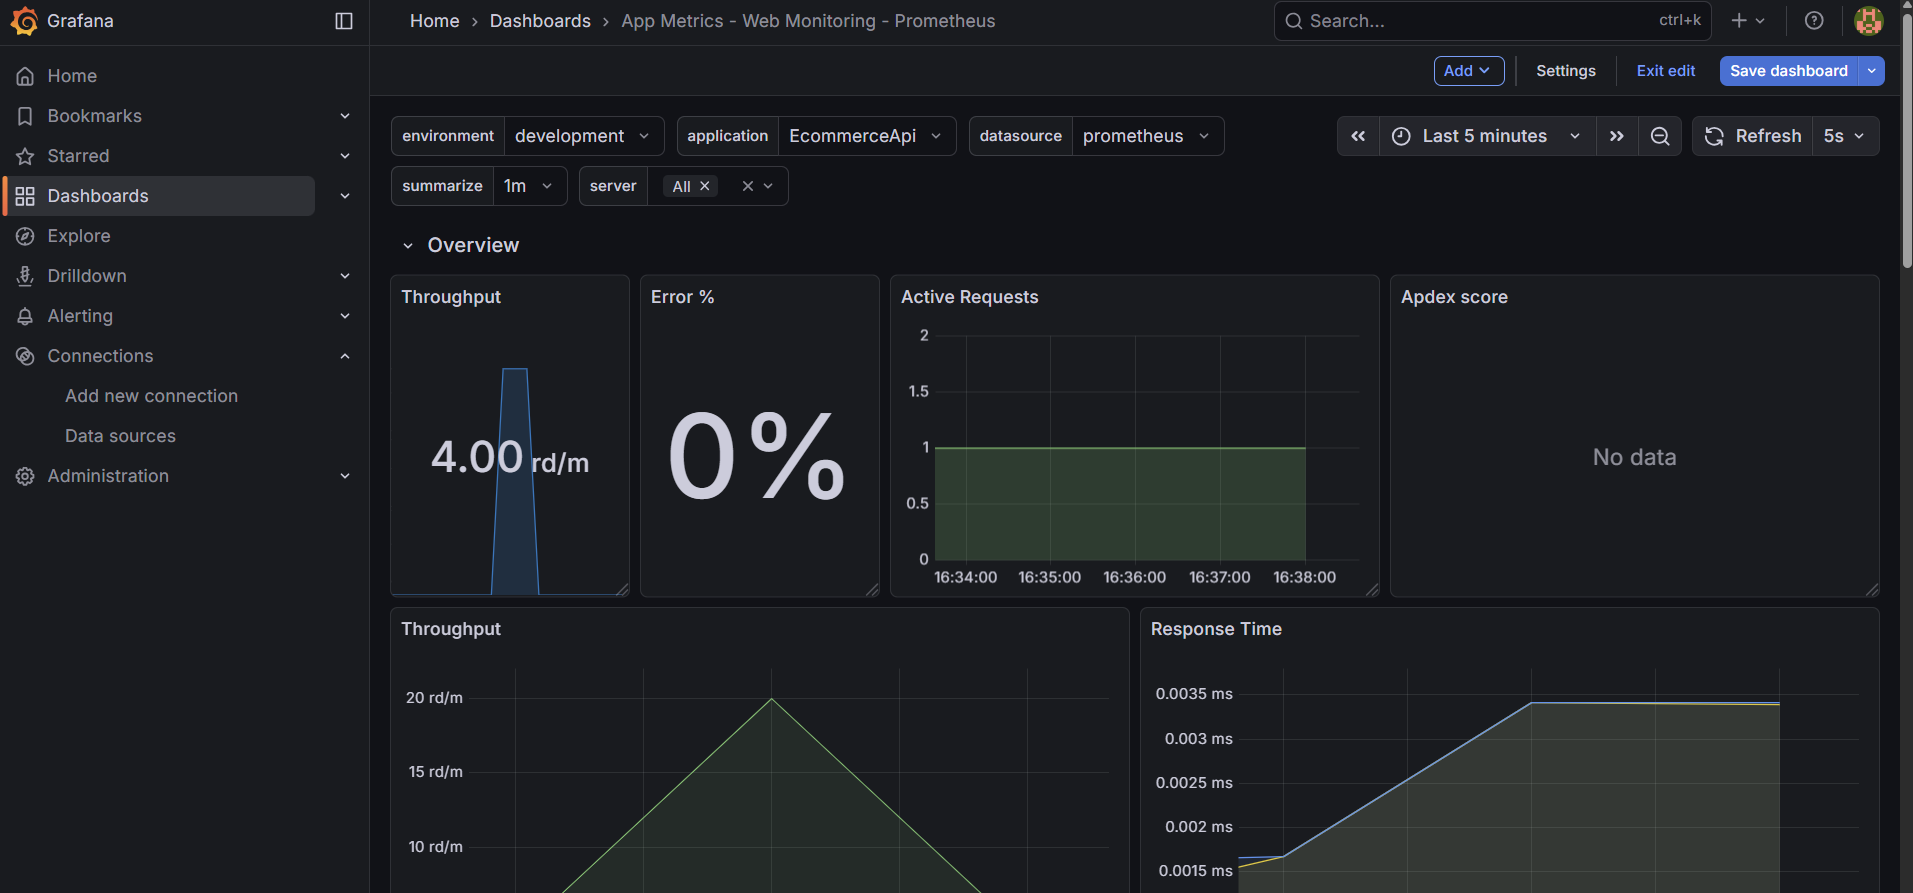
Step 11: Import Pre-Built Dashboards in Grafana
- Click on the “+” icon on the top right and select “Import Dashboard”.
- Let’s import a dashboard from Grafana’s dashboard repository. For example, you can use the dashboard ID
4334for a Prometheus overview dashboard it is called - ‘App Metrics - Web Monitoring - Prometheus’. - Visit Grafana Dashboards to find more dashboards. If you want to explore more dashboards, you can search for “.NET Core” or “App Metrics” to find relevant dashboards and you will get the dashboard ID from there.
- Enter
4334in the “Import via grafana.com” field and click “Load”. - Select the Prometheus data source you added earlier and click “Import”.
- Save the dashboard.
- You will see the following dashboard:
Conclusion Implementing metrics and dashboards for your .NET Core APIs using Prometheus and Grafana significantly enhances your application’s observability. By following the steps outlined in this guide, you can effectively monitor your API’s performance, track key metrics, and visualize data through customizable dashboards. This setup not only helps in identifying performance bottlenecks but also aids in proactive issue resolution, ensuring a robust and reliable application.

Comments